In just a few years, mobile apps have transformed from being a novelty to must-haves for smartphone users. But despite the increase in app usage and app choices, the number of apps used per user is staying the same, according to a recent report from Nielsen.
 The study found that on average, US smartphone users accessed 26.7 apps per month in the last quarter of 2014—a number that has remained relatively flat over the last two years. And if that weren’t bad enough news for app developers, over 70 percent of total app usage is coming from the top 200 apps.
However, while app users appear to have a threshold as to the total number of apps they’re willing or able to actively use during the month, the time they spend engaging on those apps has increased dramatically. The monthly time spent per person has increased from 23 hours and two minutes in late 2012 to 37 hours and 28 minutes in late 2014—a 63 percent rise in two years. So the reward for being one of the chosen apps is heavier engagement by the user.
App usage by gender and ethnicity
The study also found that while men’s monthly app usage was a bit higher than women (27.2 vs. 26.3 apps, respectively), female users spend a little more time with their apps. Women spend an average of 38 hours and two minutes per month on apps while men spend 36 hours and 51 minutes per month.
Another key takeaway from Nielsen’s analysis is the diversity of app usage among different races and ethnicities.
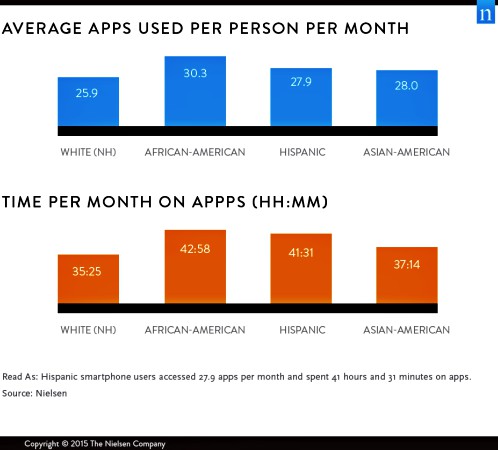 African-Americans not only use the most apps per month (30.3), but also spend the most time on them–nearly 43 hours per month. Hispanics spend 41 and a half hours across an average of about 28 apps per month. Asian-Americans average 37 hours and 14 minutes per month on 28 apps, while white non-Hispanic users spend about 35 and a half hours per month on only about 26 apps.
We love our entertainment apps
 The growing number of entertainment apps is a contributor to the overall increase in app usage, according to the study. In fact, not only have entertainment apps seen a 13 percent increase in unique audience year-over-year as of fourth-quarter 2014, but this audience is spending nearly three hours more on apps over the same period—a 26 percent growth. Nielsen includes even weather and sports reporting apps in the entertainment category, although some might consider them to be informational.
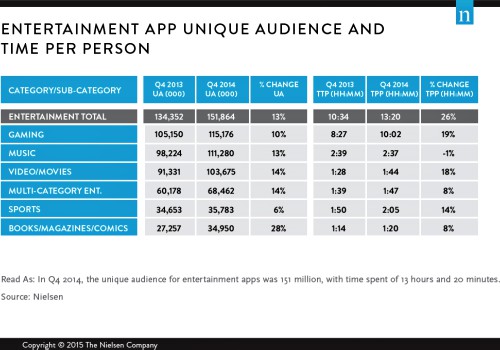 Mobile gaming remains the most popular form of entertainment, with 76 percent of app users (115 million) playing at least one game in the fourth of quarter 2014, and mobile gaming time spent increased by over an hour and a half per month to just over 10 hours.
Music apps are still the second most popular entertainment app usage and growing, with a 13 million increase year over year. Meanwhile, video and movie app usage grew to nearly 104 million users and an hour and 44 minutes per month.
About the report
Nielsen’s insights about mobile app usage were gathered using Nielsen’s Mobile NetView app, which is installed with permission on panelist smartphones (approximately 5,000 panelists ages 18+ with Android and iOS handsets). The panelists are recruited online in English and include Hispanic, African-American and Asian-American consumer representation.