
Would you believe that nearly two out of three of smartphone users in the U.S. might go a few months without downloading a single new mobile application?
That’s just one of the surprising findings from a new report on U.S. mobile app usage by tech research company comScore. The report summarizes findings from a mobile app usage survey of U.S. based smartphone and tablet users aged 18 and over, during a three-month period ending in June.
 Of the smartphone users in the study, 65.5 percent didn’t download a single mobile app during the three months of the study. Even if that number changes a little bit when extrapolated to the entire population, it seems clear that app makers and stores have to work better at marketing.
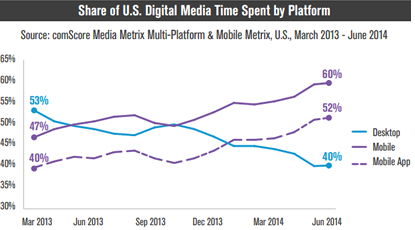
ComScore says that just last year, mobile first surpassed desktop in terms of total digital media engagement in the United States. Then this year, another key milestone: mobile apps now make up a majority of all digital media time spent, at least in the States. Total U.S. digital media time jumped 24 percent over the past year, driven by a 52 percent surge in mobile app usage.
When adding in mobile browser time along with mobile apps, total mobile activity in the U.S. recently passed 60 percent, as desktop now accounts for the remaining 40 percent, according to comScore.
How many apps do we download and really use?
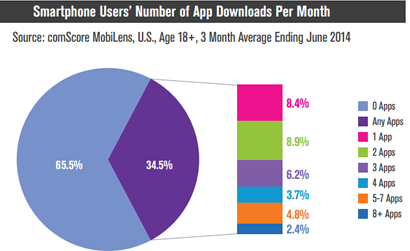 Here’s where it gets interesting. About only a third of all U.S. smartphone owners in the study downloaded at least one app each month – with three new apps a month being the average. Shockingly, just 7 percent of the study’s smartphone users claimed half of all download activity, and only 2.4 percent of users downloaded eight apps or more a month.
Clearly, there seems to still be lots of opportunity for app developers to rack up more downloads. The trick then, is to increase user engagement.
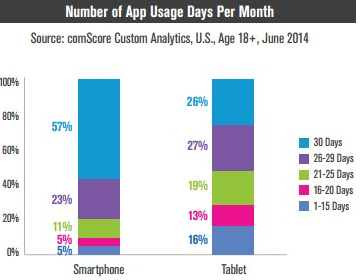
Luckily for app makers, more people are now addicted to mobile apps. More than half (57 percent) of smartphone users accessed apps every single day of the month during the three-month comScore study, while 26 percent of tablet users did so. And nearly 8 out of 10 users accessed apps at least 26 days per month, while 52 percent of tablet users did so.
 Facebook, Instagram or Twitter, anyone? Social networking apps topped the list in the study of users’ favorite (most used) apps, eating up a quarter of total mobile app time. Mobile games took up 16 percent of all app time, and radio or streaming music apps were third, with 8 percent of time. Those were followed by multimedia and shopping apps with 5 percent of app time each, and then messaging and photo apps with 4 percent each. Apps in “other” categories accounted for the remaining third (34 percent) of app time.
Another challenge for small developers: nine of the top ten most used apps in the study are from six giant companies: Amazon, Apple, eBay, Facebook, Google, and Yahoo. And those six companies also account for 16 of the top 25 apps, and 24 of the top 50 apps.
Smartphone users spent 42 percent of all app time on their most used app, and nearly three out of every four minutes of app time was spent on one of the user’s top four most used apps. That means that all other apps downloaded have to fight for the remaining 25 percent of the user’s app time – no small task for an app developer.
iPhone & iPad users: bigger app spenders?
Many mobile users – especially iDevice owners – seem to have money to spend. As found in similar studies, comScore’s report shows iPhone users using apps more often than Android phone owners – an average of 9 hours more per month. It also reveals that iPhone owners in the study tended to be younger and with higher yearly incomes – an average of $85,000 – versus $61,000 for Android users.
Although engagement is now higher for mobile apps than for desktop and mobile browsers, app makers have so far not made much money from in-app advertising. But don’t give up yet – like any emerging advertising medium, it takes time for the ad infrastructure to develop, says comScore.
Another consideration: ads are easier to view on larger screens, so advertisers and developers should think about placing visual or audio ads into apps as seamlessly as in-app purchases, but more unobtrusively.
You can download comScore’s U.S. mobile app usage report for free from the company’s website.